We use cookies to enhance the usability of our website. If you continue, we'll assume that you are happy to receive all cookies. More information. Don't show this again.
On the top, protein expression in current human tissue, based on all annotated cell types, is reported with the units not detected (n), low (l), medium (m) and high (h). Underneath, protein expression in each annotated cell type are reported using the same units.
Protein expression data is based on knowledge-based annotation. For genes where more than one antibody has been used, a collective score is set.
If knowledge-based annotation could not be performed for a gene, no data is displayed here. View antibody staining data further down this page.
No data
RNA expressioni
A summary of mRNA expression data available for current tissue based on several datasets. The mRNA expression levels in human tissues are based on RNA-seq data generated by the Human Protein Atlas (HPA), Genotype-Tissue Expression (GTEx) portal and CAGE data generated by the FANTOM5 consortium. Consensus normalized expression levels for human tissues was created by combining the data from HPA and GTEx datasets.
The mRNA expression levels in pig are based on RNA-seq data generated by the Human Protein Atlas (HPA), and for mouse, HPA data and in situ hybridization generated by the Allen brain atlas are reported.
Scroll down to view mRNA expression data in more detail.
Consensus:
2929.7
nTPM
HPA:
2929.7
nTPM
FANTOM5:
8.9
Scaled Tags Per Million
COLON - Annotated protein expression
Pending normal tissue analysis
COLON - HPA RNA-seqi
The RNA-seq details section shows detailed information about the individual samples used for the transcript profiling and results of the RNA-seq analysis.
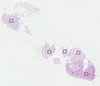
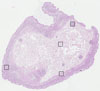
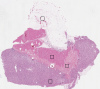
Information about each individual sample is listed below, including gender, age, a tissue section image and estimated fractions of cell types. nTPM (normalized transcripts per million) values give a quantification of the gene abundance which is comparable between different genes and samples.
Average nTPM
2929.7
Male, age 54
Colon sample 67 nTPM: 3202.8
Cell types%
Glandular cells:
65
Smooth muscle cells:
10
Other cell types:
25
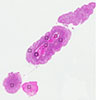
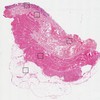
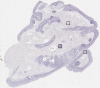
Female, age 57
Colon sample 68 nTPM: 1508.3
Cell types%
Glandular cells:
40
Smooth muscle cells:
5
Other cell types:
55
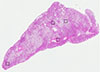
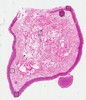
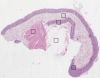
Male, age 80
Colon sample 69 nTPM: 2283.7
Cell types%
Glandular cells:
55
Smooth muscle cells:
5
Other cell types:
40
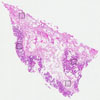
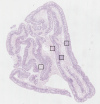
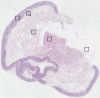
Male, age 68
Colon sample 70 nTPM: 427.2
Cell types%
Glandular cells:
35
Smooth muscle cells:
10
Other cell types:
55
Female, age 68
Colon sample 76 nTPM: 4850.1
Cell types%
Glandular cells:
25
Smooth muscle cells:
5
Other cell types:
70
Female, age 61
Colon sample 299 nTPM: 1192.6
Cell types%
Glandular cells:
5
Smooth muscle cells:
65
Other cell types:
30
Male, age 80
Colon sample 300 nTPM: 1292.9
Cell types%
Glandular cells:
15
Smooth muscle cells:
20
Other cell types:
65
Female, age 78
Colon sample 368 nTPM: 2187.2
Cell types%
Glandular cells:
45
Smooth muscle cells:
5
Other cell types:
50
Male, age 84
Colon sample 381 nTPM: 3680.1
Cell types%
Glandular cells:
50
Smooth muscle cells:
15
Other cell types:
35
Male, age 80
Colon sample 384 nTPM: 5523.7
Cell types%
Glandular cells:
20
Smooth muscle cells:
35
Other cell types:
45
Female, age 78
Colon sample 389 nTPM: 3167.3
Cell types%
Glandular cells:
35
Smooth muscle cells:
10
Other cell types:
55
Female, age 69
Colon sample 391 nTPM: 2939.9
Cell types%
Glandular cells:
10
Smooth muscle cells:
45
Other cell types:
45
Female, age 72
Colon sample 403 nTPM: 5830
Cell types%
Glandular cells:
20
Smooth muscle cells:
15
Other cell types:
65
COLON - FANTOM5 CAGEi
RNA expression in human tissues obtained through Cap Analysis of Gene Expression (CAGE) generated by the FANTOM5 project are reported as Scaled Tags Per Million.
 The Human Protein Atlas project is funded