We use cookies to enhance the usability of our website. If you continue, we'll assume that you are happy to receive all cookies. More information. Don't show this again.
On the top, protein expression in current human tissue, based on all annotated cell types, is reported with the units not detected (n), low (l), medium (m) and high (h). Underneath, protein expression in each annotated cell type are reported using the same units.
Protein expression data is based on knowledge-based annotation. For genes where more than one antibody has been used, a collective score is set.
If knowledge-based annotation could not be performed for a gene, no data is displayed here. View antibody staining data further down this page.
h
m
l
n
Cells in endometrial stroma:
Not detected
Glandular cells:
Medium
RNA expressioni
A summary of mRNA expression data available for current tissue based on several datasets. The mRNA expression levels in human tissues are based on RNA-seq data generated by the Human Protein Atlas (HPA), Genotype-Tissue Expression (GTEx) portal and CAGE data generated by the FANTOM5 consortium. Consensus normalized expression levels for human tissues was created by combining the data from HPA and GTEx datasets.
The mRNA expression levels in pig are based on RNA-seq data generated by the Human Protein Atlas (HPA), and for mouse, HPA data and in situ hybridization generated by the Allen brain atlas are reported.
Scroll down to view mRNA expression data in more detail.
Consensus:
191.2
nTPM
HPA:
113.1
nTPM
GTEx:
191.2
nTPM
FANTOM5:
147.2
Scaled Tags Per Million
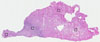
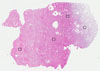
ENDOMETRIUM 1 - Antibody stainingi
Antibody staining in the annotated cell types in the current human tissue is reported as not detected, low, medium, or high, based on conventional immunohistochemistry profiling in selected tissues. This score is based on the combination of the staining intensity and fraction of stained cells.
Each image is clickable and will lead to virtual microscopy that enables deeper exploration of all samples and also displays staining intensity scores, fraction scores and subcellular localization as well as patient and tissue information for each sample.
Antibody CAB020825
Antibody CAB040557
Cells in endometrial stroma
Not detected
Not detected
Glandular cells
Low
High
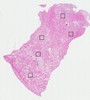
ENDOMETRIUM 2 - Antibody stainingi
Antibody staining in the annotated cell types in the current human tissue is reported as not detected, low, medium, or high, based on conventional immunohistochemistry profiling in selected tissues. This score is based on the combination of the staining intensity and fraction of stained cells.
Each image is clickable and will lead to virtual microscopy that enables deeper exploration of all samples and also displays staining intensity scores, fraction scores and subcellular localization as well as patient and tissue information for each sample.
Antibody CAB020825
Antibody CAB040557
Cells in endometrial stroma
Not detected
Not detected
Glandular cells
Not detected
Low
ENDOMETRIUM - HPA RNA-seqi
The RNA-seq details section shows detailed information about the individual samples used for the transcript profiling and results of the RNA-seq analysis.
Information about each individual sample is listed below, including gender, age, a tissue section image and estimated fractions of cell types. nTPM (normalized transcripts per million) values give a quantification of the gene abundance which is comparable between different genes and samples.
Average nTPM
113.1
Female, age 34
Endometrium sample 113 nTPM: 135.1
Cell types%
Glandular cells:
5
Stromal cells:
25
Smooth muscle cells:
65
Other cell types:
5
Female, age 56
Endometrium sample 114 nTPM: 81.8
Cell types%
Glandular cells:
5
Stromal cells:
15
Smooth muscle cells:
75
Other cell types:
5
Female, age 40
Endometrium sample 268 nTPM: 123.1
Cell types%
Glandular cells:
5
Stromal cells:
20
Smooth muscle cells:
70
Other cell types:
5
Female, age 60
Endometrium sample 297 nTPM: 146.8
Cell types%
Glandular cells:
5
Stromal cells:
20
Smooth muscle cells:
75
Other cell types:
0
Female, age 83
Endometrium sample 301 nTPM: 78.5
Cell types%
Glandular cells:
5
Stromal cells:
10
Smooth muscle cells:
80
Other cell types:
5
ENDOMETRIUM - GTEx RNA-seqi
RNA-Seq data generated by the Genotype-Tissue Expression (GTEx) project from human tissues is reported as mean nTPM. More information can be found on the GTEx portal.
Distribution across the dataset is visualized with box plots, shown as median and 25th and 75th percentiles. Points are displayed as outliers if they are above or below 1.5 times the interquartile range. nTPM values of the individual samples are presented next to the box plot.
Average nTPM
191.2
GTEx sample id
Sample description
nTPM
Uterus - Endometrium Average nTPM: 191.2
Samples: 16
Max nTPM: 277.9
Min nTPM: 125.7
Std nTPM: 42.5
Median nTPM: 178.1
GTEX-R55G-1626-SM-48FF4
40-49 years, female
277.9
GTEX-T5JW-1526-SM-4DM5E
20-29 years, female
260.4
GTEX-PWN1-2026-SM-48TD9
40-49 years, female
234.2
GTEX-T6MO-1526-SM-4DM57
40-49 years, female
224.9
GTEX-P78B-2526-SM-3P5ZY
40-49 years, female
224.3
GTEX-13QBU-1626-SM-5LU4S
40-49 years, female
214.3
GTEX-XUZC-0926-SM-4BOQF
30-39 years, female
183.1
GTEX-XV7Q-1526-SM-4BRWB
40-49 years, female
182.4
GTEX-U3ZN-0726-SM-4DXT5
30-39 years, female
173.9
GTEX-11EM3-1926-SM-5987U
20-29 years, female
172.5
GTEX-ZTPG-2026-SM-5O999
20-29 years, female
172.4
GTEX-S32W-1426-SM-4AD66
50-59 years, female
168.6
GTEX-ZVT2-0426-SM-5E44S
50-59 years, female
162.2
GTEX-PX3G-2026-SM-48U1H
20-29 years, female
154.5
GTEX-PWCY-1426-SM-48TCT
20-29 years, female
128.8
GTEX-Y114-1826-SM-4TT87
50-59 years, female
125.7
Show allShow less
ENDOMETRIUM - FANTOM5 CAGEi
RNA expression in human tissues obtained through Cap Analysis of Gene Expression (CAGE) generated by the FANTOM5 project are reported as Scaled Tags Per Million.


 The Human Protein Atlas project is funded