We use cookies to enhance the usability of our website. If you continue, we'll assume that you are happy to receive all cookies. More information. Don't show this again.
All assays through which the antibody has been validated. Assays&annotation provide a detailed description of the different assays. The pie-charts indicate degree of validation.
Immunocytochemistry is used to validate the antibody staining and for assessing and validating the protein expression pattern in selected human cell lines.
Validationi
Results of validation by standard or enhanced validation.
Standard validation is based on concordance with available experimental gene/protein characterization data in the UniProtKB/Swiss-Prot database. Standard validation results in scores Supported, Approved or Uncertain.
Enhanced validation is performed using either siRNA knockdown, tagged GFP cell lines or independent antibodies. For the siRNA validation the decrease in antibody-based staining intensity upon target protein downregulation is evaluated. For the GFP validation the signal overlap between the antibody staining and the GFP-tagged protein is evaluated. For the independent antibodies validation the evaluation is based on comparison of the staining of two (or more) independent antibodies directed towards independent epitopes on the protein.
For all cases except the siRNA validation, an image representative of the antibody staining pattern is shown. For the siRNA validation, a box plot of the results is shown.
Enhanced - Independent antibodiesi
This method is based on comparing the staining pattern using two independent antibodies with no overlapping epitopes. A similar staining pattern (main and additional locations) results in an enhanced antibody validation.
Antibody staining overlaps with antibody HPA019716 & HPA026720.
Immunofluorescent staining of human cell line U2OS shows localization to mitochondria. Protein location across all samples similar between independent antibodies
Enhanced - Independent antibodiesi
This method is based on comparing the staining pattern using two independent antibodies with no overlapping epitopes. A similar staining pattern (main and additional locations) results in an enhanced antibody validation.
Antibody staining overlaps with antibody HPA019714 & HPA026720.
Immunofluorescent staining of human cell line U2OS shows localization to mitochondria. Protein location across all samples similar between independent antibodies
N/A
Enhanced - Independent antibodiesi
This method is based on comparing the staining pattern using two independent antibodies with no overlapping epitopes. A similar staining pattern (main and additional locations) results in an enhanced antibody validation.
Antibody staining overlaps with antibody HPA019714 & HPA019716.
Immunofluorescent staining of human cell line U-251MG shows localization to mitochondria. Protein location across all samples similar between independent antibodies
Antibody dilution
Human assay: A-431 fixed with PFA, dilution: 1:20 Human assay: U2OS fixed with PFA, dilution: 1:20
Human assay: A-431 fixed with PFA, dilution: 1:100 Human assay: U-251MG fixed with PFA, dilution: 1:100 Human assay: U2OS fixed with PFA, dilution: 1:100
Human assay: A-431 fixed with PFA, dilution: 1:100 Human assay: U-251MG fixed with PFA, dilution: 1:100 Human assay: U2OS fixed with PFA, dilution: 1:100
IMMUNOHISTOCHEMISTRYi
Immunohistochemistry is used for validating antibody reliability by assessing staining pattern in 44 normal tissues. Validation scores include Enhanced, Supported, Approved and Uncertain.
Validationi
Results of validation by standard or enhanced validation based on assessment of antibody performance in 44 normal tissues.
Standard validation results in scores Supported, Approved or Uncertain. An image representative of the antibody staining pattern is shown.
Enhanced validation results in the score Enhanced and includes two methods: Orthogonal validation and Independent antibody validation. For orthogonal validation, representative images of high and low expression are shown. For independent antibody validation, four images of each independent antibody are displayed.
Enhanced - Independent antibodies
Protein distribution across 45 tissues similar between the independent antibodies HPA019714, HPA019716, HPA019848 and HPA026720.
Antigen retrieval is a method used to restore/retrieve the epitope (antibody bidning region) of the target protein, cross-linked, and thus masked, during tissue preserving fixative treatment of the tissues.
HIER pH6
HIER pH6
HIER pH6
HIER pH6
Antibody dilution
1:300
1:750
1:1200
1:850
Literature conformityi
Conformance of the expression pattern with available gene/protein characterization data in scientific literature and data from bioinformatic predictions.
UniProt is used as the main source of gene/protein characterization data and when relevant, available publications and other sources of information are researched in depth. Extensive or sufficient gene/protein data requires that there is evidence of existence on a protein level and that a substantial quantity of published experimental data is available from literature and public databases. Limited protein/gene characterization data does not require evidence of existence on a protein level and refers to genes for which only bioinformatic predictions and scarce published experimental data is available.
Consistent with extensive gene/protein characterization data.
Consistent with extensive gene/protein characterization data.
Consistent with extensive gene/protein characterization data.
Consistent with extensive gene/protein characterization data.
RNA consistencyi
Consistency between immunohistochemistry data and consensus RNA levels is divided into five different categories: i) High consistency, ii) Medium consistency, iii) Low consistency, iv) Very low consistency, and v) Cannot be evaluated.
High consistency between antibody staining and RNA expression data.
High consistency between antibody staining and RNA expression data.
High consistency between antibody staining and RNA expression data.
High consistency between antibody staining and RNA expression data.
WESTERN BLOTi
A Western blot analysis is performed on a panel of human tissues and cell lines to evaluate antibody specificity. For antibodies with unreliable result a revalidation using an over-expression lysate is performed.
Validationi
Western Blot is used for quality control of the polyclonal antibodies generated in the project. After purification, the antibodies are used to detect bands in a setup of lysate and different tissues. The result is then scored Enhanced, Supported, Approved, or Uncertain.
Enhanced validation includes five different methods: Genetic validation, Recombinant expression validation, Independent antibody validation, Orthogonal validation and Capture MS validation.
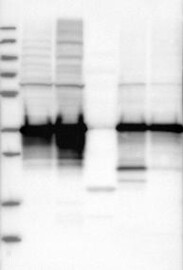
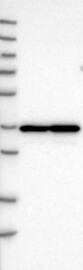
Enhanced - Independent antibodiesi
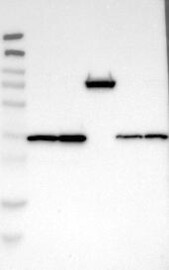
This method is based on comparing the staining pattern using two independent antibodies with no overlapping epitopes. The staining of the two antibodies is compared by Western blot through analyses of samples from at least two cell lysates preferably expressing the target protein at different levels. The results show similar Western Blot patterns achieved with independent antibodies.
Antibody band pattern is confirmed by antibody HPA019716, HPA019848 & HPA026720. Analysis performed using a standard panel of samples.
230
130
95
72
56
36
28
17
11
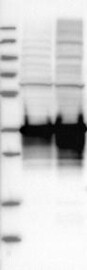
Enhanced - Capture MSi
This method is based on comparison between the molecular weight of the stained band visualized by the antibody against the protein size obtained by a capture MS method in which multiple gel slices are cut out from the electrophoretic separation of cell lysates of RT4 and U-251 and analysed separately by proteomics. The band detected by the antibody should be equivalent to the same of the intended target protein and its peptide(s).
Antibody band pattern is confirmed by capture-MS.
230
130
95
72
56
36
28
17
11
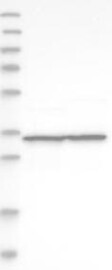
Enhanced - Independent antibodiesi
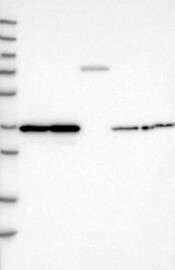
This method is based on comparing the staining pattern using two independent antibodies with no overlapping epitopes. The staining of the two antibodies is compared by Western blot through analyses of samples from at least two cell lysates preferably expressing the target protein at different levels. The results show similar Western Blot patterns achieved with independent antibodies.
Antibody band pattern is confirmed by antibody HPA019714, HPA019848 & HPA026720. Analysis performed using a standard panel of samples.
230
130
95
72
56
36
28
17
11
Enhanced - Capture MSi
This method is based on comparison between the molecular weight of the stained band visualized by the antibody against the protein size obtained by a capture MS method in which multiple gel slices are cut out from the electrophoretic separation of cell lysates of RT4 and U-251 and analysed separately by proteomics. The band detected by the antibody should be equivalent to the same of the intended target protein and its peptide(s).
Antibody band pattern is confirmed by capture-MS.
230
130
95
72
56
36
28
17
11
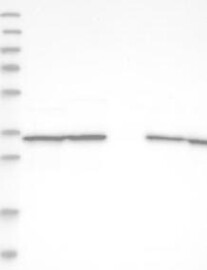
Enhanced - Independent antibodiesi
This method is based on comparing the staining pattern using two independent antibodies with no overlapping epitopes. The staining of the two antibodies is compared by Western blot through analyses of samples from at least two cell lysates preferably expressing the target protein at different levels. The results show similar Western Blot patterns achieved with independent antibodies.
Antibody band pattern is confirmed by antibody HPA019714, HPA019716 & HPA026720. Analysis performed using a standard panel of samples.
230
130
95
72
56
36
28
17
11
Enhanced - Capture MSi
This method is based on comparison between the molecular weight of the stained band visualized by the antibody against the protein size obtained by a capture MS method in which multiple gel slices are cut out from the electrophoretic separation of cell lysates of RT4 and U-251 and analysed separately by proteomics. The band detected by the antibody should be equivalent to the same of the intended target protein and its peptide(s).
Antibody band pattern is confirmed by capture-MS.
230
130
95
72
56
36
28
17
11
Enhanced - Independent antibodiesi
This method is based on comparing the staining pattern using two independent antibodies with no overlapping epitopes. The staining of the two antibodies is compared by Western blot through analyses of samples from at least two cell lysates preferably expressing the target protein at different levels. The results show similar Western Blot patterns achieved with independent antibodies.
Antibody band pattern is confirmed by antibody HPA019714, HPA019716 & HPA019848. Analysis performed using a standard panel of samples.
230
130
95
72
56
36
28
17
11
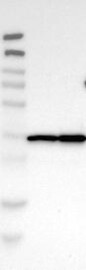
Enhanced - Orthogonali
This method is based on manual evaluation by comparing the antibody band intensity against the corresponding protein levels quantified by mass spectrometry (MS) or expression determined by RNA-seq. Antibodies are considered enhanced where the staining intensity and protein expression levels show the same expression pattern. A standard panel of two cell lines (RT4 and U-251) are used and the target protein must express the target at different levels.
Antibody band intensities is confirmed by MS TMT data.
230
130
95
72
56
36
28
17
11
Enhanced - Capture MSi
This method is based on comparison between the molecular weight of the stained band visualized by the antibody against the protein size obtained by a capture MS method in which multiple gel slices are cut out from the electrophoretic separation of cell lysates of RT4 and U-251 and analysed separately by proteomics. The band detected by the antibody should be equivalent to the same of the intended target protein and its peptide(s).
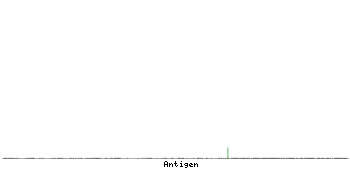
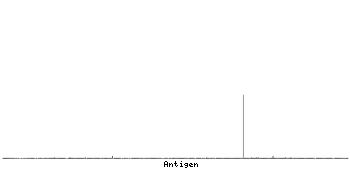
A protein array containing 384 different antigens including the antibody target is used to analyse antibody specificity. Depending on the array interaction profile the antibody is scored as Supported, Approved, or Uncertain.
Supported
Pass with single peak corresponding to interaction only with its own antigen.
Antibody specificity analysis with protein arrays. Predicted and matching interactions are shown in green.
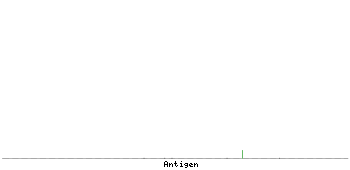
Supported
Pass with single peak corresponding to interaction only with its own antigen.
Antibody specificity analysis with protein arrays. Predicted and matching interactions are shown in green.
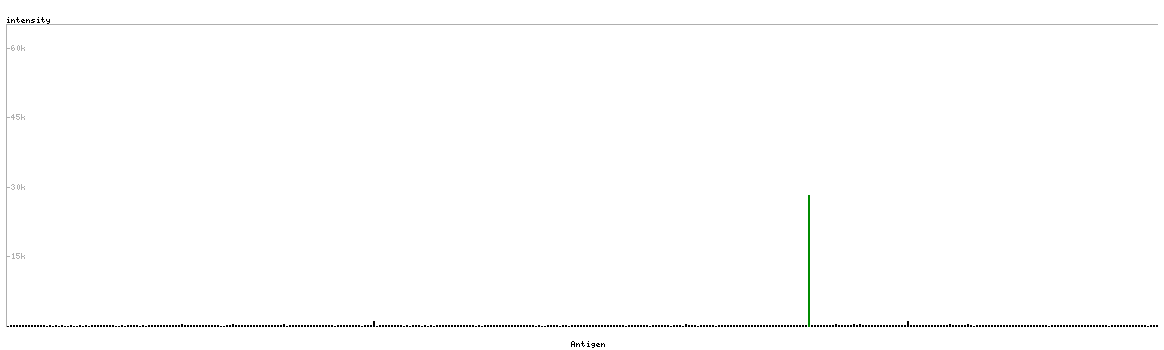
Supported
Pass with single peak corresponding to interaction only with its own antigen.
Antibody specificity analysis with protein arrays. Predicted and matching interactions are shown in green.
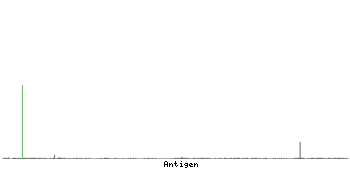
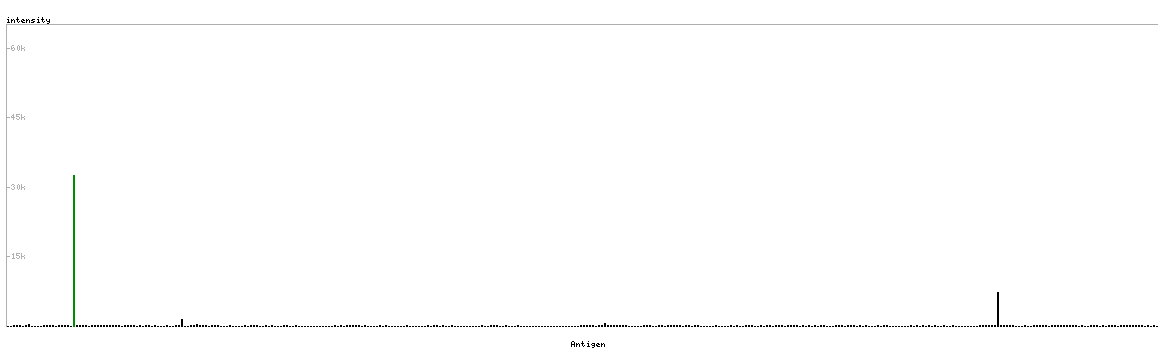
Approved
Pass with quality comment low specificity (binding to 1-2 antigens >15% and <40%).
Antibody specificity analysis with protein arrays. Predicted and matching interactions are shown in green.
The Structure section provides predicted structures from the Alphafold protein structure database and includes
structures corresponding to uniprot entries mapped to our gene set with at least one splice variant having 100% identity to the structure sequence.
Displaying protein features on the AlphaFold structures
Individual splice variants can be selected in the top part of the Protein Browser (see below) and both for transcripts matching the whole structure and those corresponding only to a part the full-length AlphaFold structure is shown.
Different transcript-related features such as transmembrane regions, InterPro domains and antigen sequences for antibodies can be displayed in the structure by clicking on the respective features in the Protein Browser and then also the part of the structure corresponding to the selected transcript will be shown in lightblue. Clinical and population amino acid variants can be highlighted by using the sliders to the right of the structure, which can also be used to colour the entire structure by residue index or make the structure autorotate.The structures are displayed using the NGL Viewer and can also be zoomed-in and rotated manually.
The Protein Browser
The protein browser displays the antigen location on the target protein(s) and the features of the target protein. The tabs at the top of the protein view section can be used to switch between the different splice variants to which an antigen has been mapped.
At the top of the view, the position of the antigen (identified by the corresponding HPA identifier) is shown as a green bar. A yellow triangle on the bar indicates a <100% sequence identity to the protein target.
Below the antigens, the maximum percent sequence identity of the protein to all other proteins from other human genes is displayed, using a sliding window of 10 aa residues (HsID 10) or 50 aa residues (HsID 50). The region with the lowest possible identity is always selected for antigen design, with a maximum identity of 60% allowed for designing a single-target antigen (read more).
The curve in blue displays the predicted antigenicity i.e. the tendency for different regions of the protein to generate an immune response, with peak regions being predicted to be more antigenic.The curve shows average values based on a sliding window approach using an in-house propensity scale. (read more).
If a signal peptide is predicted by a majority of the signal peptide predictors SPOCTOPUS, SignalP 4.0, and Phobius (turquoise) and/or transmembrane regions (orange) are predicted by MDM, these are displayed.
Low complexity regions are shown in yellow and InterPro regions in green. Common (purple) and unique (grey) regions between different splice variants of the gene are also displayed (read more), and at the bottom of the protein view is the protein scale.

 The Human Protein Atlas project is funded