We use cookies to enhance the usability of our website. If you continue, we'll assume that you are happy to receive all cookies. More information. Don't show this again.
General description of the gene and the encoded protein(s) using information from HGNC and Ensembl, as well as predictions made by the Human Protein Atlas project.
Gene namei
Official gene symbol, which is typically a short form of the gene name, according to HGNC.
Assigned HPA protein class(es) for the encoded protein(s).
Metabolic proteins Transporters
Predicted locationi
All transcripts of all genes have been analyzed regarding the location(s) of corresponding protein based on prediction methods for signal peptides and transmembrane regions.
Genes with at least one transcript predicted to encode a secreted protein, according to prediction methods or to UniProt location data, have been further annotated and classified with the aim to determine if the corresponding protein(s) are secreted or actually retained in intracellular locations or membrane-attached.
Remaining genes, with no transcript predicted to encode a secreted protein, will be assigned the prediction-based location(s).
The annotated location overrules the predicted location, so that a gene encoding a predicted secreted protein that has been annotated as intracellular will have intracellular as the final location.
Membrane
Number of transcriptsi
Number of protein-coding transcripts from the gene as defined by Ensembl.
13
HUMAN PROTEIN ATLAS INFORMATIONi
Summary of RNA expression and protein localization based on data generated within the Human Protein Atlas project.
Single cell type expression clusteri
The RNA data was used to cluster genes according to their expression across single cell types. Clusters contain genes that have similar expression patterns, and each cluster has been manually annotated to describe common features in terms of function and specificity.
Extravillous trophoblasts - Unknown function (mainly)
Single cell type specificityi
The RNA specificity category is based on mRNA expression levels in the analyzed cell types based on scRNA-seq data from normal tissues. The categories include: cell type enriched, group enriched, cell type enhanced, low cell type specificity and not detected.
Group enriched (Extravillous trophoblasts, Syncytiotrophoblasts)
Tau specificity scorei
Tau specificity score is a numerical indicator of the specificity of the gene expression across cells or tissues. The value ranges from 0 and 1, where 0 indicates identical expression across all cells/tissue types, while 1 indicates expression in a single cell/tissue type.
0.63
Immune cell specificityi
The RNA specificity category is based on mRNA expression levels in the analyzed samples based on data from HPA. The categories include: cell type enriched, group enriched, cell type enhanced, low cell type specificity and not detected.
Immune cell enhanced (neutrophil)
Immune cell distributioni
The RNA distribution category is based on mRNA expression levels in the analyzed samples based on data from HPA. The categories include: detected in all, detected in many, detected in some, detected in single and not detected.
Detected in all
Protein evidencei
Evidence score for genes based on UniProt protein existence (UniProt evidence); neXtProt protein existence (neXtProt evidence);and a Human Protein Atlas antibody- or RNA based score (HPA evidence). The avaliable scores are evidence at protein level, evidence at transcript level, no evidence, or not avaliable.
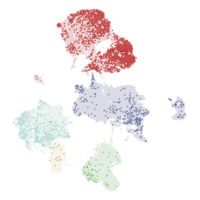
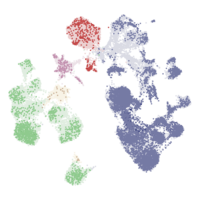
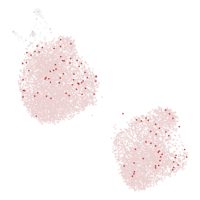
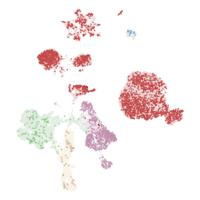
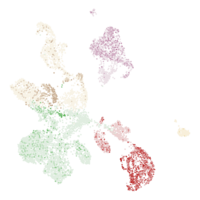
A summary of normalized single cell RNA (nTPM) from all single cell types. Color-coding is based on cell type groups, each consisting of cell types with functional features in common.
Single cell types
Group
Expression
Alphabetical
RNA single cell type specificity: Group enriched (Extravillous trophoblasts, Syncytiotrophoblasts)
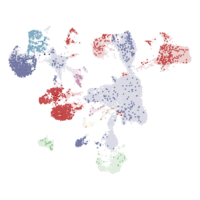
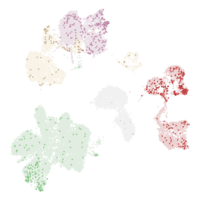
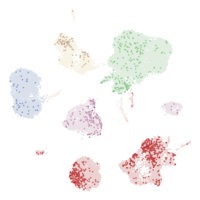
SINGLE CELL TISSUES OVERVIEWi
An overview of all tissues where single cell type expression has been analyzed. Each tissue name and corresponding UMAP plot is clickable and redirects to the selected tissue.
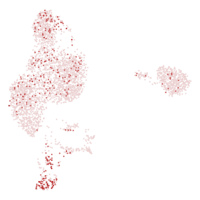
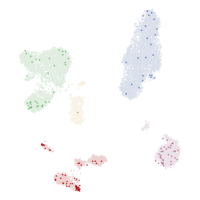
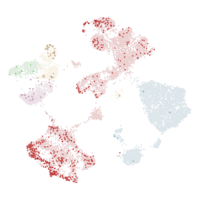
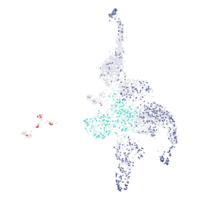
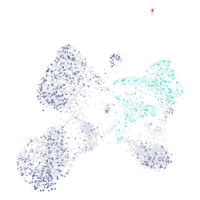
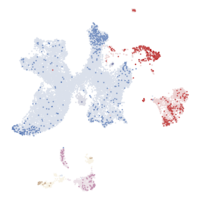
The RNA data was used to cluster genes according to their expression across samples. The resulting clusters have been manually annotated to describe common features in terms of function and specificity. The annotation of the cluster is displayed together with a confidence score of the gene's assignment to the cluster. The confidence is calculated as the fraction of times the gene was assigned to this cluster in repeated calculations and is reported between 0 to 1, where 1 is the highest possible confidence. The clustering results are shown in a UMAP, where the cluster this gene was assigned to is highlighted as a colored area in which most of the cluster genes reside. A table shows the 15 most similar genes in terms of expression profile.
SLC16A3 is part of cluster 4Extravillous trophoblasts - Unknown function with confidencei
Confidence is the fraction of times a gene was assigned to the cluster in repeated clustering, and therefore reflects how strongly associated it is to the cluster. A confidence of 1 indicates that the gene was assigned to this cluster in all repeated clusterings.
Correlation between the selected gene and neighboring gene. Correlation is calculated as Spearman correlation in PCA space based on the RNA-seq expression data.
Clusteri
ID of the expression cluster of the neighboring gene.
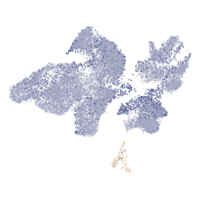
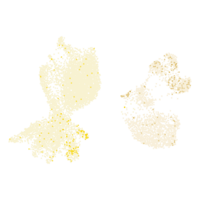
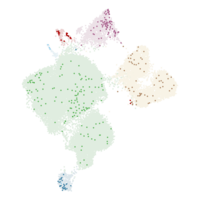
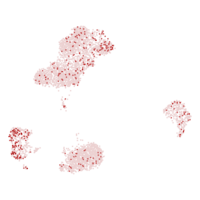
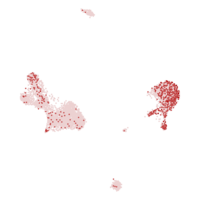
Single cell RNA levels of annotated cell type clusters are shown separately for each analyzed tissue. For easier navigation across tissues, use the above Single cell tissue overview, where each tissue name and UMAP plot is clickable and redirects to the selected tissue, alternatively the grey browser on the left side of the window. Barchart shows nTPM levels in each annotated cluster of single cells. To the left, a UMAP plot illustrates the RNA expression profile. The tissue name and plots are clickable and redirect to a more detailed interactive page. Color-coding is based on cell type groups, each consisting of cell types with functional features in common. Please note that the same cell type may be found in several clusters.
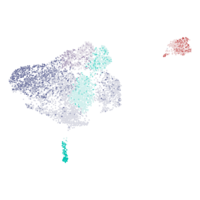
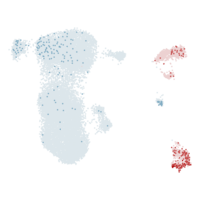
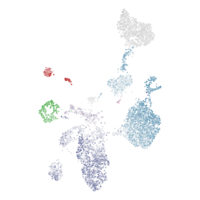
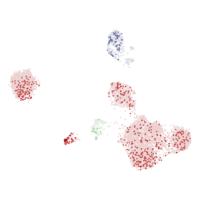
RNA expression in blood on a single cell level from two datasets: - Single cell data includes scRNA-seq data from clusters of various peripheral blood mononuclear cell types (PBMC) and endothelial cells. A barchart shows nTPM levels in each cluster and to the left, a UMAP plot visualizes the RNA expression profile. Both are clickable and redirect to more Single Cell Type data. - Flow sorting data includes RNA-seq data (pTPM) from immune cell types and total peripheral blood mononuclear cells (PBMC) that have been separated into subpopulations by flow sorting. The plot is clickable and redirects to more Immune Cell data. Color-coding is based on cell type groups, each consisting of cell types with functional features in common. Please note that the same cell type may be found in several clusters. Color-coding is based on cell type groups, each consisting of cell types with functional features in common. Please note that the same cell type may be found in several clusters.


 The Human Protein Atlas project is funded