Search result
SUMMARY

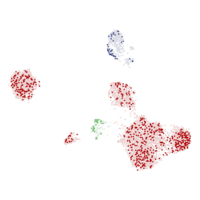
TISSUE
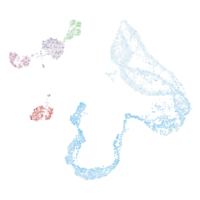
BRAIN
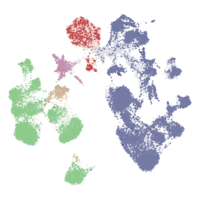
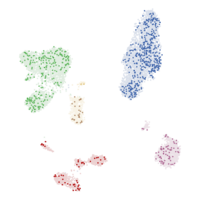
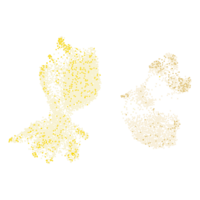
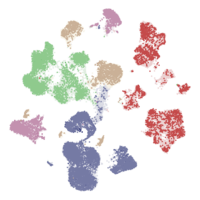
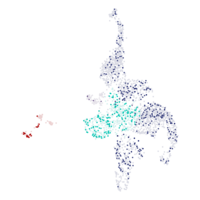
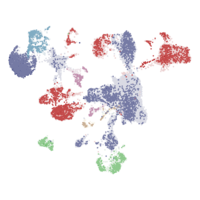
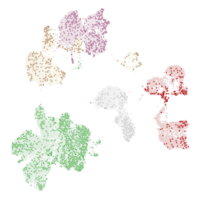
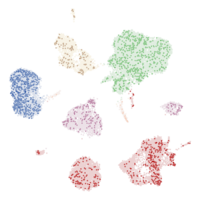
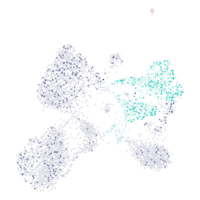
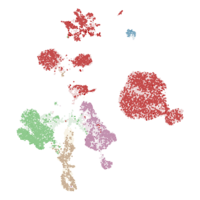
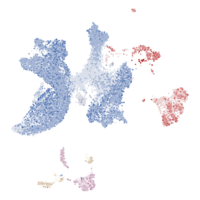
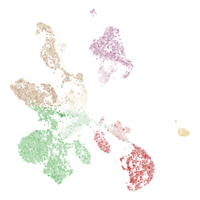
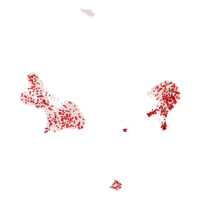
SINGLE CELL
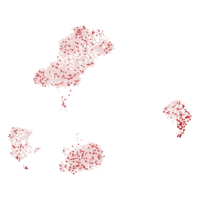
TISSUE CELL
PATHOLOGY
DISEASE
IMMUNE
BLOOD

SUBCELL
CELL LINE
STRUCTURE
INTERACTION
|
||||||||||||||||||||||||||||||||||||||||||||||||||||||||||||||||||||||||||||||||||||||||||||||||||||
| Adipocytes | 45.8 nTPM |
| Adipose tissue | 56.0 nTPM |
| Breast | 35.7 nTPM |
| Alveolar cells type 1 | 64.6 nTPM |
| Lung | 64.6 nTPM |
| Alveolar cells type 2 | 60.7 nTPM |
| Lung | 60.7 nTPM |
| Astrocytes | 19.5 nTPM |
| Brain | 19.5 nTPM |
| B-cells | 48.8 nTPM |
| Skin | 99.9 nTPM |
| Adipose tissue | 81.1 nTPM |
| Lymph node | 66.9 nTPM |
| Stomach | 62.4 nTPM |
| Esophagus | 59.0 nTPM |
| Spleen | 44.8 nTPM |
| Salivary gland | 42.8 nTPM |
| Bone marrow | 37.9 nTPM |
| Thymus | 37.6 nTPM |
| Lung | 36.2 nTPM |
| PBMC | 35.4 nTPM |
| Kidney | 15.6 nTPM |
| Liver | 14.5 nTPM |
| Basal prostatic cells | 33.0 nTPM |
| Prostate | 33.0 nTPM |
| Basal respiratory cells | 38.0 nTPM |
| Bronchus | 38.0 nTPM |
| Basal squamous epithelial cells | 26.8 nTPM |
| Esophagus | 26.8 nTPM |
| Bipolar cells | 42.9 nTPM |
| Eye | 42.9 nTPM |
| Breast glandular cells | 31.3 nTPM |
| Breast | 31.3 nTPM |
| Breast myoepithelial cells | 29.8 nTPM |
| Breast | 29.8 nTPM |
| Cardiomyocytes | 135.2 nTPM |
| Heart muscle | 135.2 nTPM |
| Cholangiocytes | 15.3 nTPM |
| Liver | 15.3 nTPM |
| Ciliated cells | 43.3 nTPM |
| Endometrium | 65.6 nTPM |
| Fallopian tube | 50.8 nTPM |
| Lung | 35.3 nTPM |
| Bronchus | 21.6 nTPM |
| Collecting duct cells | 15.6 nTPM |
| Kidney | 15.6 nTPM |
| Cone photoreceptor cells | 59.5 nTPM |
| Eye | 59.5 nTPM |
| Cytotrophoblasts | 36.0 nTPM |
| Placenta | 36.0 nTPM |
| Dendritic cells | 56.0 nTPM |
| Adipose tissue | 61.7 nTPM |
| PBMC | 50.4 nTPM |
| Distal tubular cells | 46.1 nTPM |
| Kidney | 46.1 nTPM |
| Ductal cells | 43.6 nTPM |
| Pancreas | 43.6 nTPM |
| Early spermatids | 128.6 nTPM |
| Testis | 128.6 nTPM |
| Endometrial stromal cells | 56.2 nTPM |
| Endometrium | 56.2 nTPM |
| Endothelial cells | 45.2 nTPM |
| Fallopian tube | 82.6 nTPM |
| Lung | 64.7 nTPM |
| Pancreas | 59.5 nTPM |
| Skeletal muscle | 55.9 nTPM |
| Endometrium | 55.0 nTPM |
| Salivary gland | 52.7 nTPM |
| Breast | 52.7 nTPM |
| Heart muscle | 51.1 nTPM |
| Thymus | 49.5 nTPM |
| Tongue | 47.2 nTPM |
| Vascular | 40.5 nTPM |
| Testis | 35.4 nTPM |
| Prostate | 33.8 nTPM |
| Placenta | 33.5 nTPM |
| Esophagus | 30.2 nTPM |
| Skin | 27.1 nTPM |
| Ovary | 26.4 nTPM |
| Liver | 15.1 nTPM |
| Enteroendocrine cells | 19.6 nTPM |
| Colon | 24.8 nTPM |
| Small intestine | 24.0 nTPM |
| Rectum | 10.1 nTPM |
| Erythroid cells | 45.2 nTPM |
| Liver | 55.9 nTPM |
| Bone marrow | 34.4 nTPM |
| Excitatory neurons | 42.1 nTPM |
| Brain | 42.1 nTPM |
| Exocrine glandular cells | 38.0 nTPM |
| Pancreas | 38.0 nTPM |
| Extravillous trophoblasts | 39.3 nTPM |
| Placenta | 39.3 nTPM |
| Fibroblasts | 41.7 nTPM |
| Adipose tissue | 60.2 nTPM |
| Heart muscle | 57.6 nTPM |
| Pancreas | 56.3 nTPM |
| Fallopian tube | 55.4 nTPM |
| Lung | 46.4 nTPM |
| Vascular | 44.7 nTPM |
| Prostate | 42.9 nTPM |
| Salivary gland | 42.1 nTPM |
| Skeletal muscle | 38.3 nTPM |
| Thymus | 37.7 nTPM |
| Stomach | 37.5 nTPM |
| Skin | 34.0 nTPM |
| Esophagus | 31.9 nTPM |
| Breast | 30.9 nTPM |
| Placenta | 29.8 nTPM |
| Liver | 21.3 nTPM |
| Gastric mucus-secreting cells | 24.8 nTPM |
| Stomach | 24.8 nTPM |
| Glandular and luminal cells | 70.3 nTPM |
| Endometrium | 70.3 nTPM |
| Granulocytes | 49.0 nTPM |
| Fallopian tube | 52.5 nTPM |
| Lung | 50.9 nTPM |
| Tongue | 43.7 nTPM |
| Granulosa cells | 34.4 nTPM |
| Ovary | 34.4 nTPM |
| Hepatocytes | 28.6 nTPM |
| Liver | 28.6 nTPM |
| Hofbauer cells | 38.5 nTPM |
| Placenta | 38.5 nTPM |
| Horizontal cells | 51.6 nTPM |
| Eye | 51.6 nTPM |
| Inhibitory neurons | 52.7 nTPM |
| Brain | 52.7 nTPM |
| Intestinal goblet cells | 21.2 nTPM |
| Colon | 28.5 nTPM |
| Small intestine | 18.0 nTPM |
| Rectum | 17.0 nTPM |
| Ionocytes | 28.0 nTPM |
| Bronchus | 28.0 nTPM |
| Kupffer cells | 31.9 nTPM |
| Liver | 31.9 nTPM |
| Langerhans cells | 58.1 nTPM |
| Skin | 58.1 nTPM |
| Late spermatids | 37.9 nTPM |
| Testis | 37.9 nTPM |
| Leydig cells | 25.7 nTPM |
| Testis | 25.7 nTPM |
| Lymphatic endothelial cells | 51.7 nTPM |
| Fallopian tube | 81.6 nTPM |
| Ovary | 21.8 nTPM |
| Macrophages | 54.6 nTPM |
| Adipose tissue | 105.8 nTPM |
| Tongue | 75.5 nTPM |
| Fallopian tube | 67.9 nTPM |
| Prostate | 64.8 nTPM |
| Lung | 62.8 nTPM |
| Salivary gland | 60.4 nTPM |
| Endometrium | 59.0 nTPM |
| Testis | 57.7 nTPM |
| Breast | 52.7 nTPM |
| Pancreas | 49.3 nTPM |
| Thymus | 47.6 nTPM |
| Skeletal muscle | 47.0 nTPM |
| Vascular | 46.5 nTPM |
| Kidney | 46.0 nTPM |
| Stomach | 43.7 nTPM |
| Bone marrow | 43.6 nTPM |
| Skin | 36.8 nTPM |
| Spleen | 36.1 nTPM |
| Esophagus | 34.7 nTPM |
| Melanocytes | 30.9 nTPM |
| Skin | 30.9 nTPM |
| Mesothelial cells | 32.4 nTPM |
| Thymus | 32.4 nTPM |
| Microglial cells | 26.8 nTPM |
| Brain | 26.8 nTPM |
| Monocytes | 148.1 nTPM |
| Adipose tissue | 148.1 nTPM |
| Mucus glandular cells | 42.7 nTPM |
| Salivary gland | 42.7 nTPM |
| Muller glia cells | 33.0 nTPM |
| Eye | 33.0 nTPM |
| Nk-cells | 49.3 nTPM |
| Adipose tissue | 65.5 nTPM |
| PBMC | 33.2 nTPM |
| Oligodendrocyte precursor cells | 24.1 nTPM |
| Brain | 24.1 nTPM |
| Oligodendrocytes | 31.1 nTPM |
| Brain | 31.1 nTPM |
| Oocytes | 180.1 nTPM |
| Ovary | 180.1 nTPM |
| Ovarian stromal cells | 33.7 nTPM |
| Ovary | 33.7 nTPM |
| Pancreatic endocrine cells | 54.3 nTPM |
| Pancreas | 54.3 nTPM |
| Paneth cells | 21.4 nTPM |
| Small intestine | 24.2 nTPM |
| Colon | 21.7 nTPM |
| Rectum | 18.5 nTPM |
| Peritubular cells | 26.7 nTPM |
| Testis | 26.7 nTPM |
| Plasma cells | 32.9 nTPM |
| Fallopian tube | 44.7 nTPM |
| Thymus | 40.5 nTPM |
| Liver | 35.0 nTPM |
| Spleen | 33.7 nTPM |
| Salivary gland | 32.7 nTPM |
| Esophagus | 31.2 nTPM |
| Stomach | 25.5 nTPM |
| Bone marrow | 19.6 nTPM |
| Prostatic glandular cells | 42.8 nTPM |
| Prostate | 42.8 nTPM |
| Proximal enterocytes | 20.2 nTPM |
| Small intestine | 20.2 nTPM |
| Proximal tubular cells | 65.0 nTPM |
| Kidney | 65.0 nTPM |
| Rod photoreceptor cells | 66.6 nTPM |
| Eye | 66.6 nTPM |
| Salivary duct cells | 48.3 nTPM |
| Salivary gland | 48.3 nTPM |
| Schwann cells | 83.6 nTPM |
| Adipose tissue | 161.6 nTPM |
| Vascular | 65.3 nTPM |
| Esophagus | 24.0 nTPM |
| Secretory cells | 44.7 nTPM |
| Fallopian tube | 44.7 nTPM |
| Serous glandular cells | 37.8 nTPM |
| Tongue | 44.2 nTPM |
| Salivary gland | 31.5 nTPM |
| Sertoli cells | 32.6 nTPM |
| Testis | 32.6 nTPM |
| Skeletal myocytes | 49.8 nTPM |
| Skeletal muscle | 49.8 nTPM |
| Smooth muscle cells | 45.1 nTPM |
| Vascular | 66.9 nTPM |
| Fallopian tube | 55.4 nTPM |
| Prostate | 55.3 nTPM |
| Endometrium | 54.0 nTPM |
| Thymus | 51.7 nTPM |
| Tongue | 49.1 nTPM |
| Adipose tissue | 48.3 nTPM |
| Skeletal muscle | 46.6 nTPM |
| Ovary | 46.3 nTPM |
| Breast | 41.8 nTPM |
| Salivary gland | 41.0 nTPM |
| Lung | 38.8 nTPM |
| Esophagus | 36.0 nTPM |
| Skin | 35.3 nTPM |
| Placenta | 28.2 nTPM |
| Liver | 27.2 nTPM |
| Spermatocytes | 183.4 nTPM |
| Testis | 183.4 nTPM |
| Spermatogonia | 161.3 nTPM |
| Testis | 161.3 nTPM |
| Squamous epithelial cells | 22.8 nTPM |
| Esophagus | 22.8 nTPM |
| Syncytiotrophoblasts | 10.0 nTPM |
| Placenta | 10.0 nTPM |
| T-cells | 41.7 nTPM |
| Adipose tissue | 100.4 nTPM |
| Fallopian tube | 63.5 nTPM |
| Endometrium | 58.7 nTPM |
| Prostate | 56.9 nTPM |
| Stomach | 50.4 nTPM |
| Tongue | 47.2 nTPM |
| Breast | 46.5 nTPM |
| Skin | 40.0 nTPM |
| Salivary gland | 39.3 nTPM |
| Vascular | 39.0 nTPM |
| Lung | 38.0 nTPM |
| Lymph node | 37.2 nTPM |
| Spleen | 32.3 nTPM |
| Thymus | 32.0 nTPM |
| Skeletal muscle | 31.8 nTPM |
| PBMC | 29.9 nTPM |
| Colon | 29.2 nTPM |
| Bone marrow | 28.5 nTPM |
| Kidney | 27.5 nTPM |
| Liver | 25.4 nTPM |
| Esophagus | 21.9 nTPM |
| Undifferentiated cells | 20.1 nTPM |
| Colon | 28.5 nTPM |
| Small intestine | 16.1 nTPM |
| Rectum | 15.7 nTPM |
 The Human Protein Atlas project is funded